Data Summary
The Data Summary panel provides an overview of your dataset, offering statistical insights, data quality metrics, and feature-level analysis.
Initialize the Panel
To create and initialize the Data Summary panel, use:
# Load the Experiment and view the data summary
from modeva import Experiment
exp = Experiment(name='Demo-SimuCredit')
exp.data_summary()
Workflow
Step 1: Load and Select Dataset
Choose a dataset from the dropdown (e.g.,
Demo-SimuCredit).Select a data split (e.g.,
main,train,test).
Step 2: Review Dataset Overview
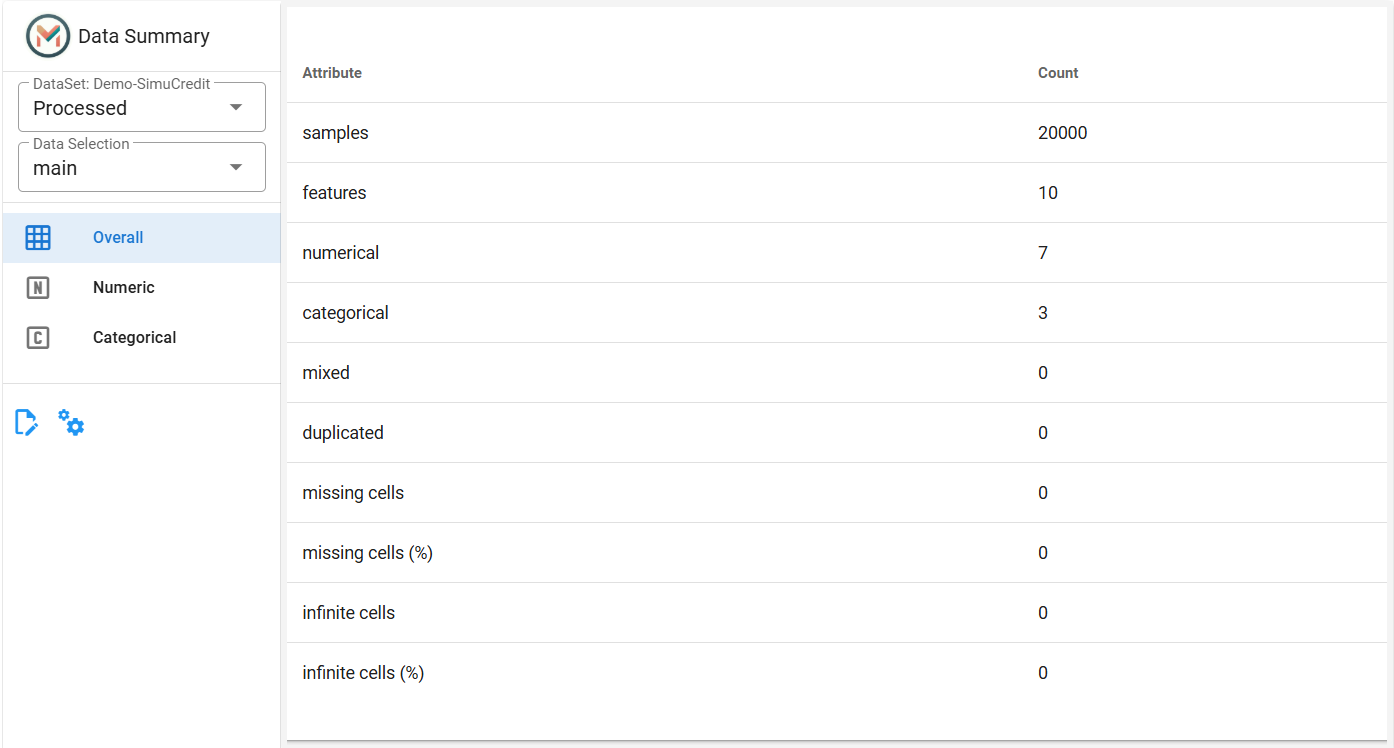
The Overview Tab displays high-level statistics about the dataset:
Data Shape: Total number of rows and columns.
Features: Count of numerical, categorical, and mixed columns.
Data Quality Metrics: Percentage of missing cells, duplicate records, and infinite values.
Step 3: Analyze Numerical Features
Switch to the Numeric Tab to explore numerical features (e.g., Mortgage, Balance).
View Statistics: View the statistics including the number of missing values, mean, first quartile (Q1), median (Q2), third quartile (Q3), minimum, and maximum values.
View Distribution: Click a row in the table to view its distribution.
Customize the Plot:
Choose between a Histogram or Density Plot.
Adjust the number of bins (Only for histogram).
Step 4: Analyze Categorical Features
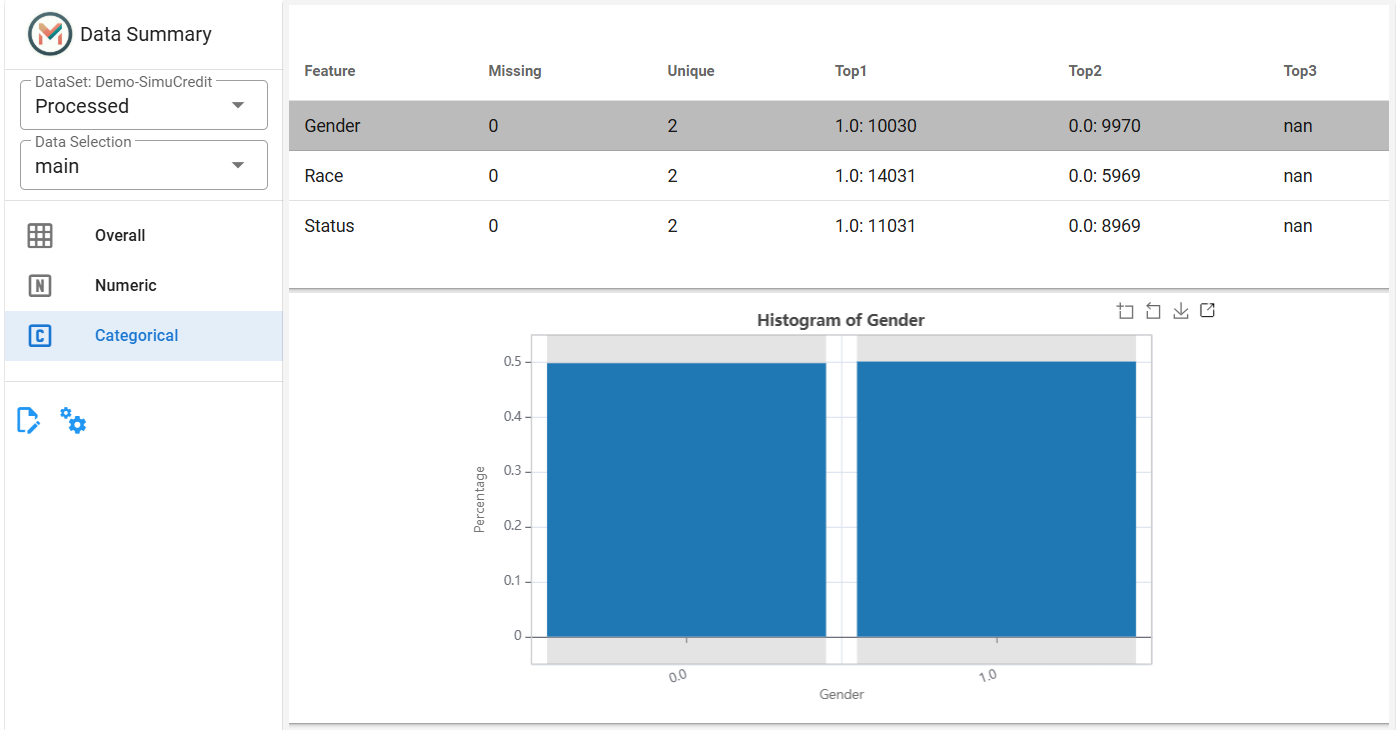
Switch to the Categorical Tab to analyze non-numeric features (e.g., Gender, Race).
View Statistics: View the statistics including the number of missing values, number of unique values, and most common category information.
View Distribution: Click a row to display the bar chart to view the distribution of the feature.
Step 5: Adjust Data Types (If Necessary)
Click the |settings_icon| to reclassify features as numerical or categorical using the radio buttons.
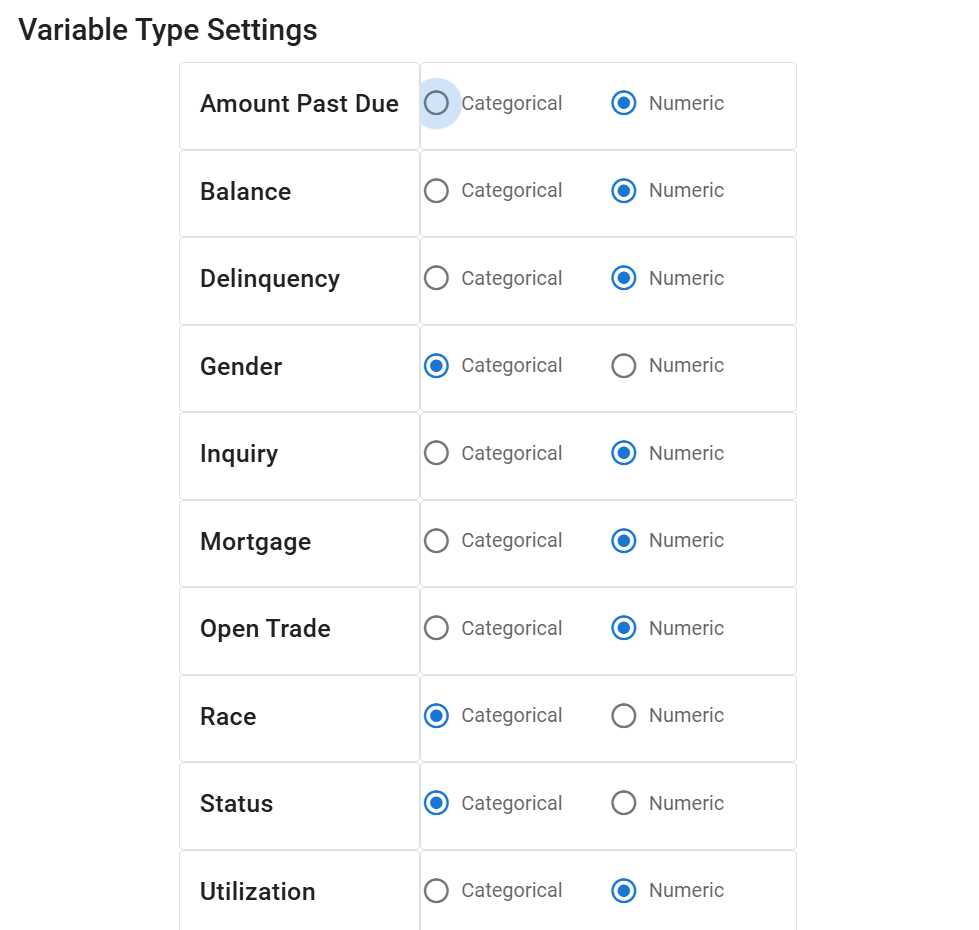
After adjustment, the Data Summary panel updates to reflect the new feature types.
Step 6: Save and Export Results
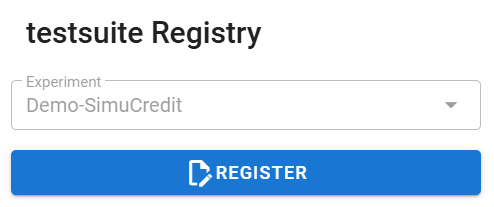
Click the |register_icon| to save plots and statistics (if configured). All registered outputs are stored in mlflow for future reference.
The Data Summary panel provides an intuitive interface for understanding your dataset’s structure and content. Combine it with other EDA tools to perform a complete exploratory analysis. For more information, refer to the Data Basic Operation.